
Measuring Bitcoin Market Psychology: Fear & Greed Index Research
Quantitative Evidence from Two Market Timing Experiments

Have you ever experienced these frustrations in the Bitcoin market:
Confidently buying the dip when the Fear and Greed Index shows "Extreme Fear," only to see the market continue plummeting; or exiting positions when the index indicates "Extreme Greed," watching helplessly as prices double again?
Can this market sentiment indicator actually predict price movements? Does it really give us an edge in the market?
In this research, I'll analyze the practical value of the Fear and Greed Index for market timing.
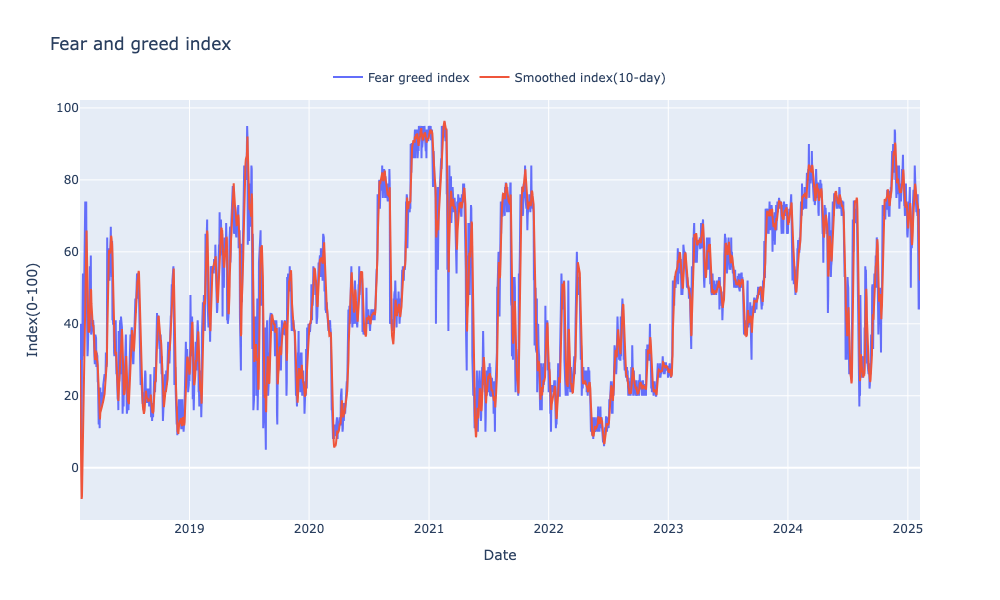
What is the Fear and Greed Index?
The Fear and Greed Index is a crucial indicator measuring Bitcoin market sentiment. It evaluates market conditions across six dimensions: Volatility (25% weight), Market Momentum/Volume (25%), Social Media Sentiment (15%), Surveys (15%), Bitcoin Dominance (10%), and Google Trends (10%). The index ranges from 0-100 and is interpreted as follows:
0-25: Extreme Fear
25-45: Fear
45-55: Neutral
55-75: Greed
75-100: Extreme Greed
The index has these characteristics:
Advantages:
Standardized range for easy interpretation
Good reflection of overall market sentiment
Disadvantages:
Not suitable for direct market timing
Can remain in extreme greed during bull markets without signaling price drops
Can persist in fear during bear markets while prices continue declining
Extreme values don't necessarily indicate price turning points
Data
Research data sources:
Fear and Greed Index from official channels
Bitcoin historical price data from Yahoo Finance
Data cleaned and merged for analysis
Experiment 1
This experiment explores whether the Fear and Greed Index can effectively identify Bitcoin's long-term tops and bottoms.
Research method:
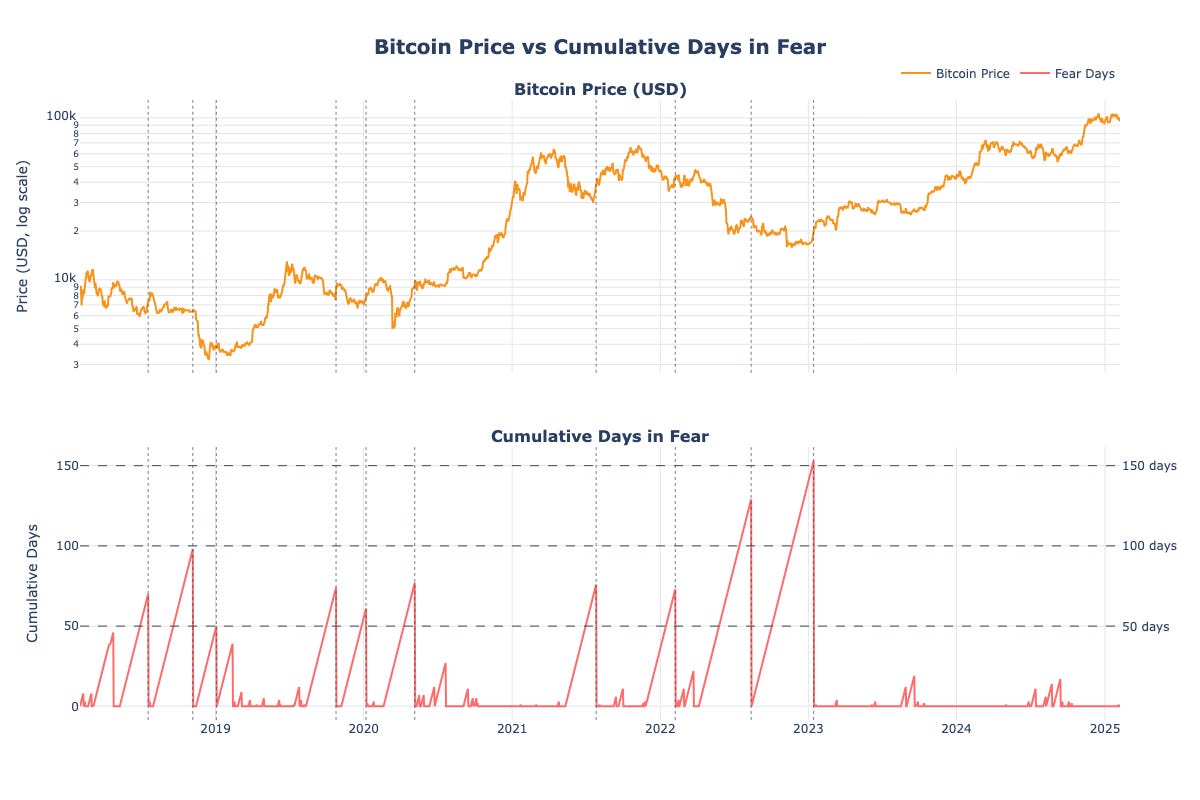
Calculate consecutive days in fear or extreme fear
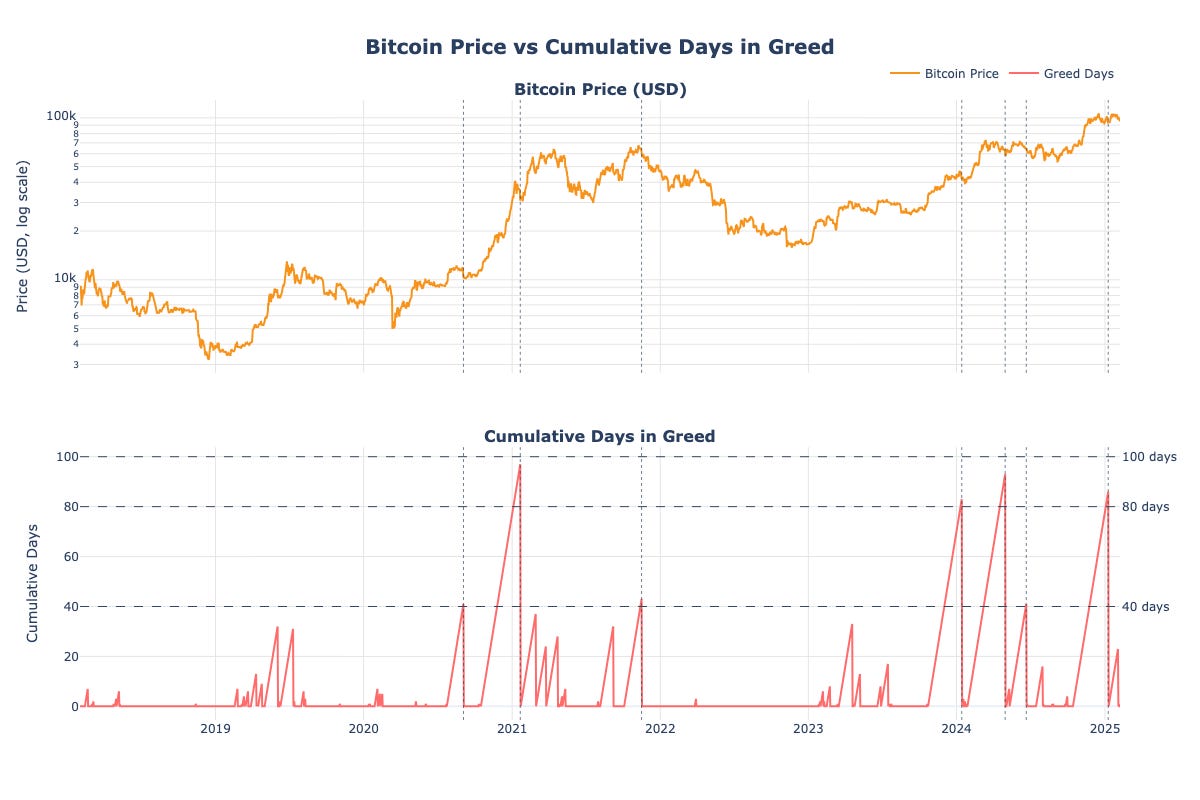
Calculate consecutive days in greed or extreme greed
Analyze correlations between these derivative indicators and Bitcoin's cyclical highs and lows
The graph below shows consecutive fear days versus Bitcoin price.
The graph below shows consecutive greed days versus Bitcoin price.
Research findings:
Even with 50, 100, or 150 cumulative fear days, accurately predicting market bottoms remains difficult
When cumulative greed days exceed 80, it typically signals an approaching cyclical top
While timing may differ from actual peaks, these warning signals are relatively reliable
Market sentiment behaves like a pendulum, never staying in extreme zones permanently
Historical data shows extreme optimism rarely persists beyond 80-100 days
Investment strategy implications:
Long-term investors should consider taking profits when cumulative greed days exceed 80
Combining this indicator with the original Fear and Greed Index helps better manage risk
Experiment 2
This experiment examines the index's ability to identify Bitcoin's 1-3 month medium-term highs and lows.
Research methodology:
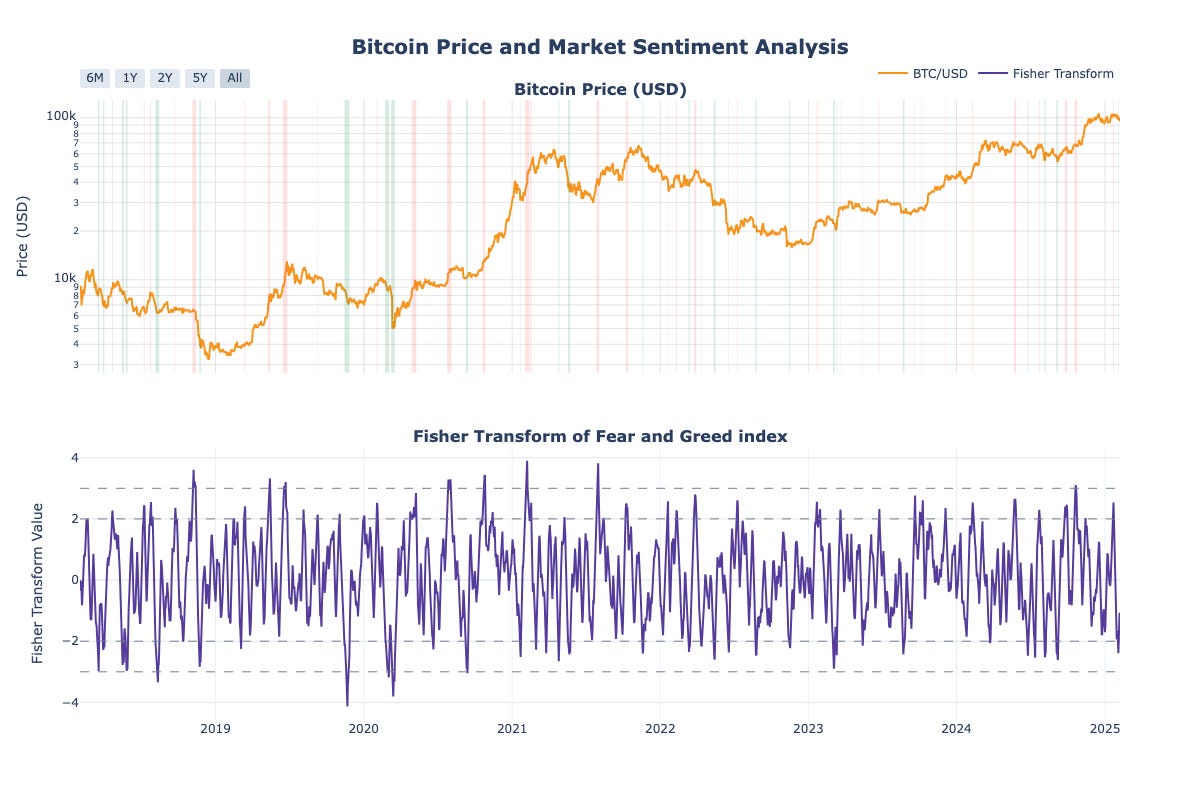
Apply Fisher transform to standardize the Fear and Greed Index
Compare standardized index with price movements
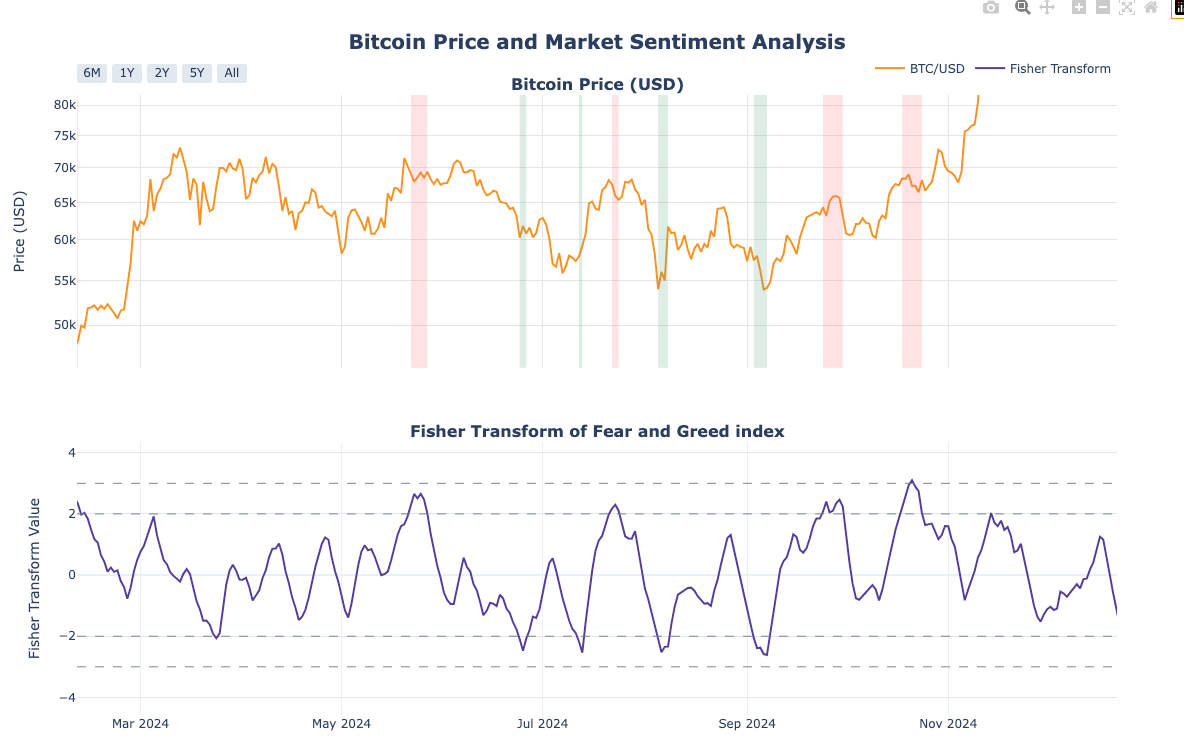
Post-Fisher transformation values represent "relative sentiment changes": values above +2 indicate excessive optimism potentially marking local tops; values below -2 suggest excessive pessimism potentially marking local bottoms.
The Fisher transform primarily serves to convert any probability distribution to an approximate normal distribution. Its main applications in time series analysis include:
Converting data to approximate normal distribution
Identifying extreme points in sequences
Output values typically range [-3, 3], with ±2 considered extreme, zero-line crossings may indicate trend changes
Primarily used for data standardization and extreme value identification, not cycle decomposition
As shown, the transformed index oscillates within [-3,3], exhibiting clear mean reversion characteristics reflecting relative sentiment changes.
Research conclusions:
During consolidation phases, the indicator can identify medium-term highs and lows, as demonstrated from May to October 2024
In trending markets, indicator performance weakens. In bear markets, readings above +2 identify bounce tops, but readings below -2 are unreliable for bottoms; similar patterns occur in bull markets
Overall, the Fisher-transformed index shows some capability in identifying medium-term highs and lows but should be used with other indicators (for market structure identification)
Conclusion
Market sentiment indicators mirror collective psychology fluctuations. Through this analysis, we find the Fear and Greed Index contains valuable market signals but cannot accurately predict price movements.
If you found this analysis helpful, please subscribe to my column for more in-depth research on cryptocurrency markets.